The moon-coverage
A python tool for mission and instrument planning

PSIDA 2022
B. Seignovert, G. Tobie, C. Vallat, N. Altobelli & I. Belgacem
Mission planning
1) Timelines and filtering

2) Tracks and footprints

3) ROI intersections

SPICE, SPICE, SPICE !!!
- NAIF toolkit / spiceypy
- MAPPS / ckviewer / ...
- Cosmographia
- Expert users
- Mission / instrument specific
- Complex setup
Can we make simpler?
🤔
Customizable SPICE visualizations for non-expert users
moon-coverage
🚀
✨
-coverage
planetary
😬
-coverage
moon
-coverage
moon
-
Python
3.8+object oriented library -
Open-source
BSDlicence -
Use only
numpy,matplotlibandspiceypy
- Founded by ESA SOC
- Developed at the LPG/Nantes Université
- Fully tested and documented package
- Available on PyPI (
0.11.0) - Deployed on ESA Datlabs in April 2021
pip install moon-coverageHow to install it?
%pip install moon-coverageESA DataLabs
recommanded

Python
Demo time ! 👀
Disclaimer: I hope you like coding!

All the figures were generated with this notebook on ESA DataLabs.
from moon_coverage import TourConfig

tour = TourConfig(
  mk=5.0,
  spacecraft='JUICE',
  target='Ganymede',
  kernels_dir='kernels/',
)
<TourConfig>
Spacecraft: JUICE
Target: GANYMEDE
Metakernel: juice_crema_5_0.tm
SKD version: v310_20220517_001SPICE object oriented
from moon_coverage import TourConfig

TourConfig(
  mk='juice_crema_5_0b23_1.tm',
  spacecraft='JUICE',
  instrument='JANUS',
  target='Callisto',
  kernels_dir='kernels/',
)
<TourConfig>
Spacecraft: JUICE
Instrument: JANUS
Target: CALLISTO
Metakernel: juice_crema_5_0b23_1.tm
SKD version: v310_20220517_001traj = tour['2035-06-01']
traj.dist # [km]3098Trajectory properties
traj = tour['2035-06-01T01:00:00']

traj.dist # [km]3145Trajectory properties
traj = tour['2035-06-01T01:00:00']

traj.dist, traj.inc, traj.emi, traj.phase
3145, 77, 0, 77Trajectory properties
traj = tour[
  '2035-06-01T01:00:00',
  '2035-06-01T01:30:00',
  '2035-06-01T02:00:00',
]

traj.dist
[3145, 3144, 3120]Trajectory properties
traj = tour['2035-06-01':'2035-06-02':'1 min']

traj.dist
[3098, 3098, 3099, ..., 3096, 3095, 3095]Trajectory properties
import matplotlib.pyplot as plt

plt.figure()

plt.plot(traj.utc, traj.alt)
Trajectory property timeline
plt.figure()

plt.plot(traj.utc, traj.alt)

plt.ylabel('Altitude (km)')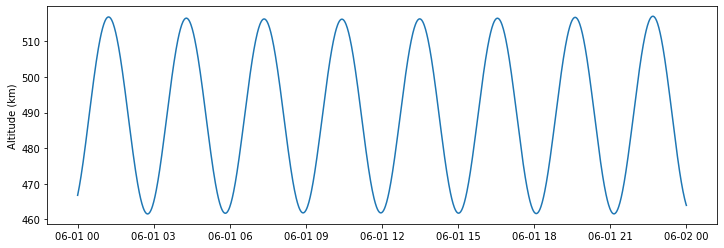
Trajectory property timeline
plt.figure()

plt.plot(traj.utc, traj.inc, color='tab:orange')

plt.ylabel('Incidence angle (°)')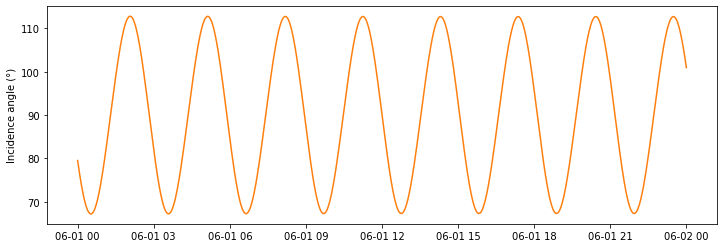
Trajectory property timeline
from moon_coverage import GANYMEDE

fig = plt.figure()
ax = fig.add_subplot(projection=GANYMEDE)

ax.plot(traj, color='white')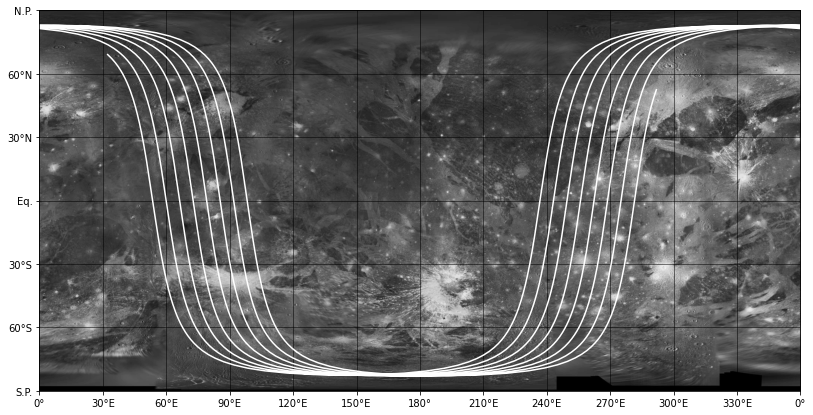
Groundtrack map
fig = plt.figure()
ax = fig.add_subplot(projection=GANYMEDE)

ax.plot(traj, 'inc')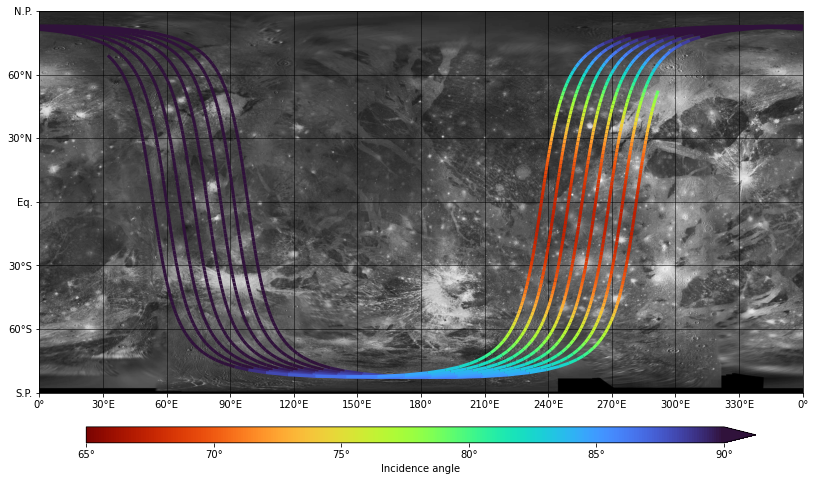
traj_day = traj.where(traj.inc < 90)

traj_day.dist
Trajectory filtering
[3098, 3098, 3099, ..., NaN, NaN, NaN]plt.figure()
plt.plot(traj.utc, traj.inc, color='gray', linestyle='--')
plt.plot(traj_day.utc, traj_day.inc, color='orange', linewidth=5)
plt.ylabel('Incidence angle (°)')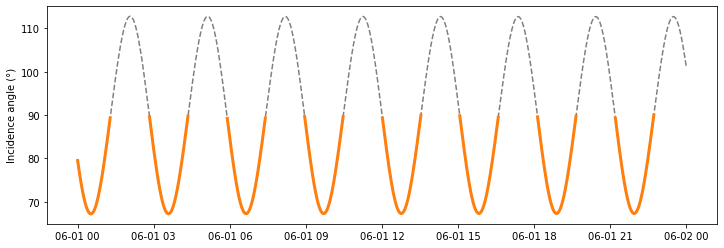
Trajectory filtering
plt.figure()

plt.plot(traj.utc, traj.inc, color='gray', linestyle='--')
plt.plot(traj_day.utc, traj_day.alt, color='blue', linewidth=5)

plt.ylabel('Altitude (km)')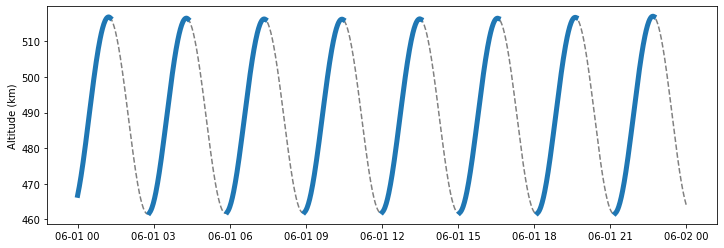
Trajectory filtering
fig = plt.figure()
ax = fig.add_subplot(projection=GANYMEDE)

ax.plot(traj, color='white', linestyle='--', linewidth=1)
ax.plot(traj_day, 'inc')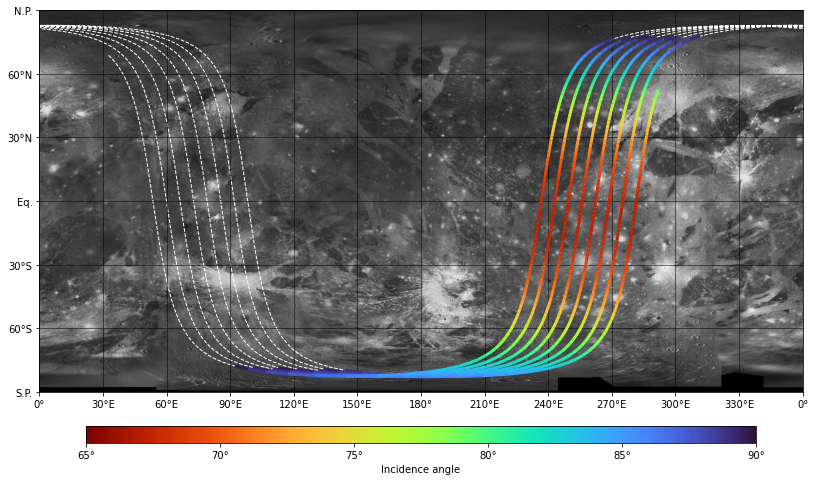
from moon_coverage import TourConfig, EUROPA

tour = TourConfig(
  mk=5.0,
  spacecraft='JUICE',
  instrument='MAJIS_IR',
  target='EUROPA',
)

traj = tour['2032-07-02T15:22:25':'2032-07-02T17:22:25':'1 sec']

fig = plt.figure()
ax = fig.add_subplot(projection=EUROPA)

ax.plot(traj, 'alt', vmin=400, vmax=5000)
15 lines from stratch to plot! 🙌

15 lines from stratch to plot! 🙌
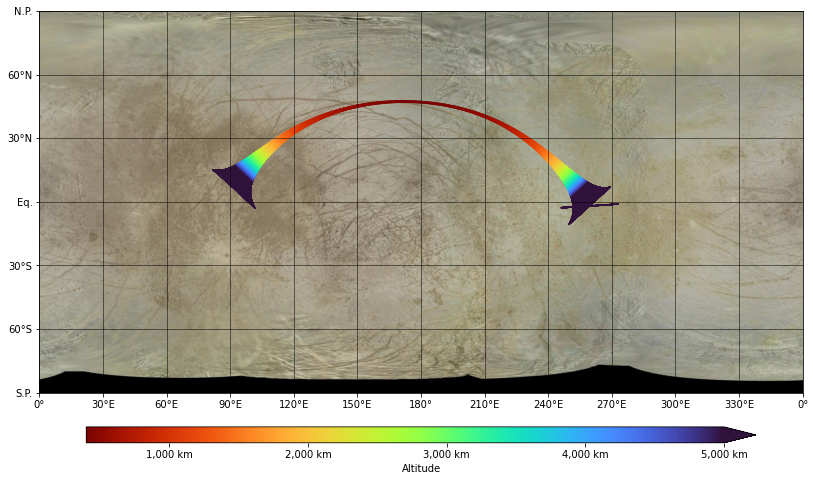
add MAJIS instrument footprint?
from moon_coverage import TourConfig, EUROPA

tour = TourConfig(
  mk=5.0,
  spacecraft='JUICE',
  instrument='MAJIS_IR',
  target='EUROPA',
)

traj = tour['2032-07-02T15:22:25':'2032-07-02T17:22:25':'1 sec']

fig = plt.figure(figsize=(20, 9))
ax = fig.add_subplot(projection=EUROPA)

ax.add_collection(traj.fovs('alt', vmin=400, vmax=5000))
add MAJIS instrument footprint?
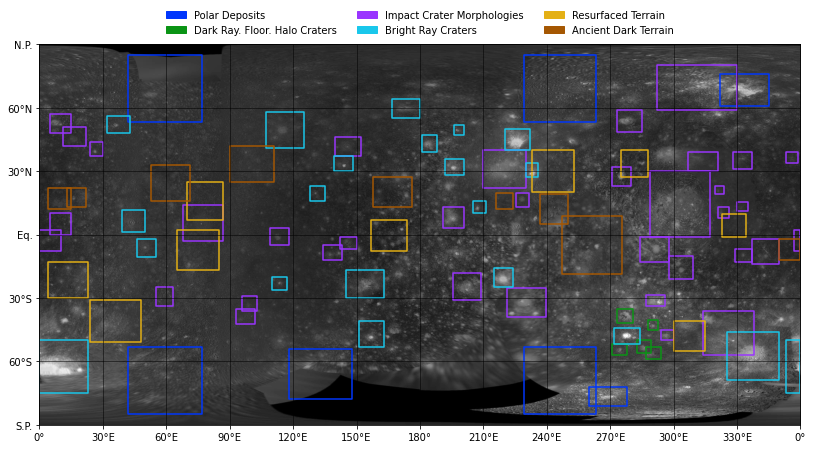
from moon_coverage import CallistoROIs, CALLISTO

fig = plt.figure()
ax = fig.add_subplot(projection=CALLISTO)

ax.add_collection(CallistoROIs)

ax.legend(handles=CallistoROIs.handles, loc='lower center',
          bbox_to_anchor=(.5, 1), ncol=3, frameon=False);
Regions of Interest (ROI)
tour = TourConfig(
    mk=5.0, spacecraft='JUICE', instrument='MAJIS_IR', target='Callisto',
)

fig = plt.figure()
ax = fig.add_subplot(projection=CALLISTO)

ax.add_collection(CallistoROIs(edgecolor='white', linestyle='--'))

for flyby in tour.flybys:
    traj = flyby.where((flyby.alt < 750) & (flyby.inc < 90))

    ax.add_collection(traj.fovs('inc', vmin=0, vmax=90))

    if traj in CallistoROIs:
        ax.plot(traj & CallistoROIs, color='red')
        ax.add_collection((CallistoROIs & traj)(edgecolor='red'))

ax.colorbar(vmin=0, vmax=90, label='inc', extend='max')
Complexe ROI intersections
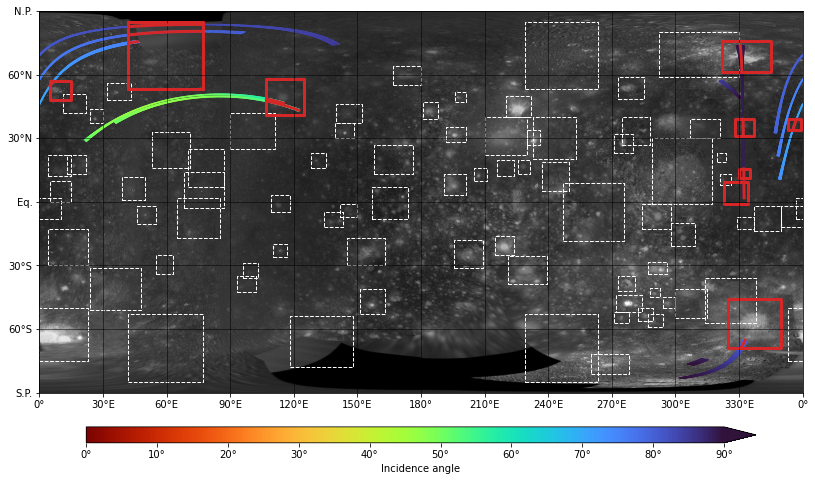
JUICE Callisto flybys planning
Summary
- moon-coverage is python generic mission planning tool library based on SPICE for non expert-user.
- Generate custom timelines, groundtrack and ROI intersections.
- Open-source, fully tested and documented, with many examples.
This presentation:
The tool:
Contact us: